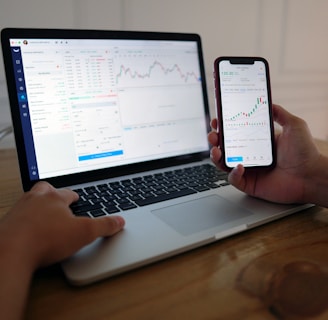
A close-up view of a smartphone displaying a financial app with a graph and numerical data, held by a hand. The screen shows the brand 'Wealthsimple'. Above it is part of a laptop keyboard with keys visible. The background consists of a wooden surface.

Gallery

Showcasing my passion for technology, finance, and innovative solutions.

A smartphone and a laptop are displayed on a wooden surface. The smartphone screen shows an app interface featuring a financial portfolio, with stock symbols and numerical values. The laptop screen shows a website login page with promotional text offering incentives for signing up.
A person holding a smartphone displaying a financial app with a graph and balance information. The phone has a black case, and the interface shows details such as investment totals and changes. The background consists of a wooden table.
A person is sitting at a wooden table using a laptop and a smartphone. Both devices display stock charts and market data, suggesting activities related to financial analysis or trading. The room is softly lit, possibly with a Christmas tree in the background.
A hand is holding a smartphone displaying a financial application. The screen shows a chart with a growth prediction in percentage, and sections labeled Personal, Retirement, and Custodial. The chart predicts cash invested and saved over a period of time, with specific dollar values provided for future growth.
A laptop displays a detailed financial chart with lines showing data trends. In the background, a person is partially visible, wearing a dark shirt with the words 'most valuable' and some logos printed on it. The setting appears to be a modern workspace.

Tech Innovations

Showcasing projects that merge technology with finance and investing.

A person is holding a smartphone displaying a financial trading app. The screen shows a candlestick chart with various trading metrics, including the current price, percentage changes, and buttons for different actions. The person's hands are visible, and a black background accentuates the smartphone screen.
Finance Solutions

Developed innovative finance solutions leveraging technology for investment efficiency and growth, enhancing decision-making processes and optimizing portfolio management strategies.

A laptop displaying a financial dashboard with various stock market graphs and data. The screen shows different stock indices and their performance, including line charts and a bar chart for market overview. The laptop is placed on a light-colored table, and a gray sofa is visible in the background.
IT Projects

Executed various IT projects focusing on software development, system integration, and technology consulting, aimed at improving operational efficiency and driving business success through tailored technological solutions.

Client Feedback

Hear what clients say about my technology and finance expertise.

Jay's insights into technology and finance transformed my investment strategy completely.

Emily Carter
A person is using a MacBook Pro, viewing financial trading information from Questrade. The screen displays detailed trading data and an app interface, emphasizing connectivity and accessibility. The image features a modern setting with a couch in the background and some houseplants.

San Francisco

Jay's deep understanding of IT and finance helped me make informed decisions.

A tablet displaying a detailed digital financial trading interface with various graphs, charts, and numerical data. The screen shows candlestick charts with green and red indicators, illustrating market trends and stock prices.
Mark Johnson

New York

★★★★★
★★★★★